Line chart
The line chart is often used to visualize the trend of contiguous data.
The following demos visualizes the development of people extreme poverty from 1820 to 2015. According to the demo, the portion of people in extreme poverty is declining over the years.
Candlestick chart
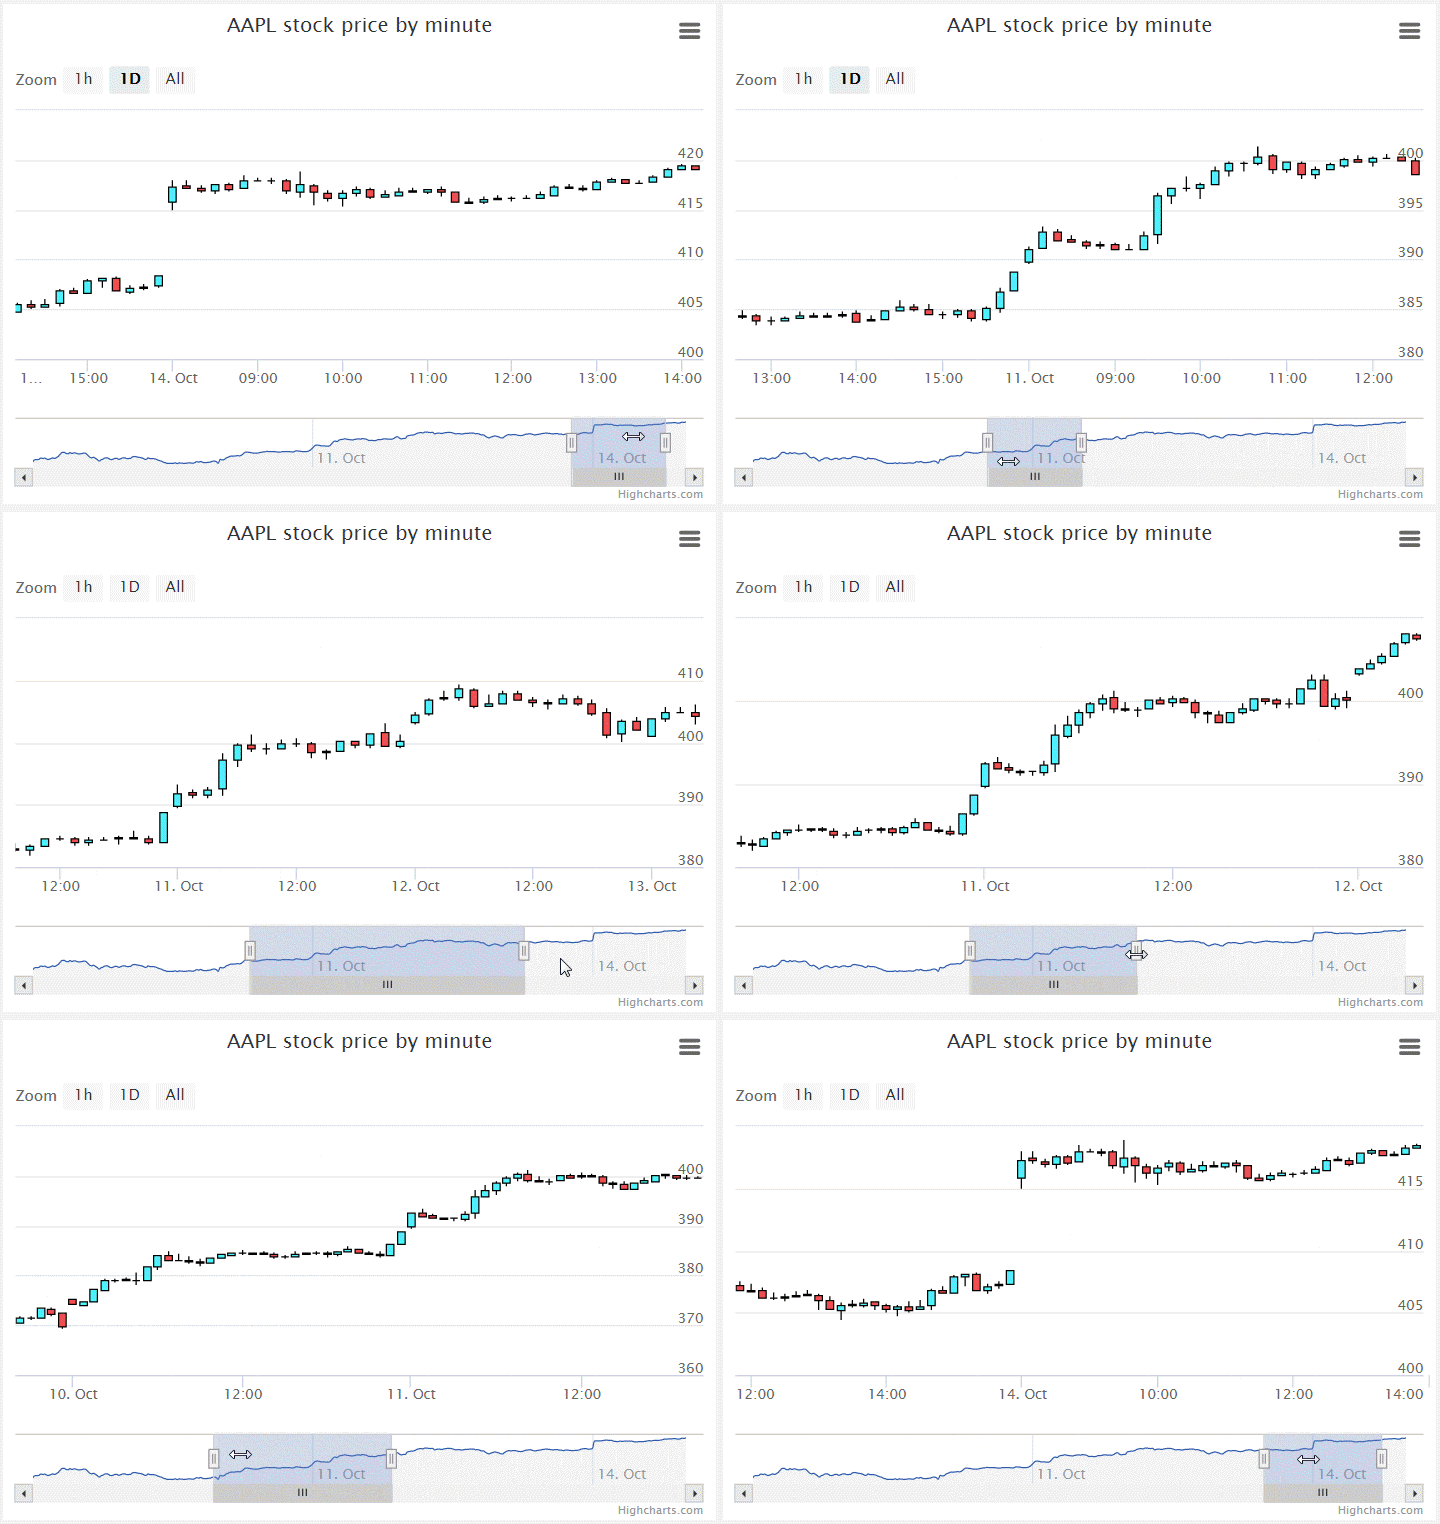
The candlestick chart is often used to visualize the price movement over time in the financial sector.
The following demo visualizes the AAPL stock price by the minute.
Use the navigator to zoom in and out and to skim over the dataset.
